ORIGINAL ARTICLE | https://doi.org/10.5005/jp-journals-10006-1750 |
Serum Lipid Profile in Second Trimester as a Predictor of Gestational Hypertension
1,3Department of Obstetrics and Gynaecology, KS Hegde Medical Academy, Mangaluru, Karnataka, India
2Department of Obstetrics and Gyneacology, Kasturba Medical College, Mangaluru, Karnataka, India
Corresponding Author: Anupama Suresh, Department of Obstetrics and Gyneacology, Kasturba Medical College, Mangaluru, Karnataka, India, Phone: +91 9448122608, e-mail: somasrinivas.vej@gmail.com
How to cite this article Rajesh A, Suresh A, Muralidharan V. Serum Lipid Profile in Second Trimester as a Predictor of Gestational Hypertension. J South Asian Feder Obst Gynae 2020;12(1):23–26.
Source of support: Nil
Conflict of interest: None
ABSTRACT
Aim: To determine serum lipid profile early in second trimester of antenatal women and to study whether antenatal women with abnormal lipid profile in 2nd trimester are prone to develop gestational hypertension or preeclampsia and to determine whether dyslipidemia can be used as a marker in predicting PIH. The study is done to evaluate relationship between serum lipid concentrations and risk of preeclampsia.
Materials and methods: Serum lipid profile was measured enzymatically by standardized assay in 90 pregnant women between 14 weeks and 20 weeks of gestation. Results were measured in terms of pregnancy induced hypertension. Out of these total number, 12 subjects developed PIH (study group), while 69 subjects remained normotensive (control group).
Results: Out of these total number, 12 subjects developed PIH (study group), while 69 subjects remained normotensive (control group). The mean serum total cholesterol (TC) level was 233.25 mg/dL with p value %3C;0.001, triglycerides (TG), and low-density lipoprotein cholesterol (LDL-C) was significantly higher in PIH women as compared to normotensive pregnant women. PIH women showed no significant change in high-density lipoprotein cholesterol (HDL-C) level and very low-density lipoprotein cholesterol (VLDL-C) to normal pregnant women.
Conclusion: Serum lipid level in early pregnancy is a very good noninvasive method to predict the of PIH before the clinical onset.
Keywords: Low-density lipoprotein cholesterol, Pregnancy-induced hypertension, Total cholesterol, Triglycerides, Very low-density lipoprotein..
INTRODUCTION
This study evaluates relationship between serum lipid profile and preeclampsia. Twenty-five percent of FGR and 15% of preterm deliveries are attributed to PIH.1 The incidence is 8–10% with a mortality rate of 8%.2 At present, there is no screening tool.3 Altered lipid synthesis leading to decrease in PGI2:TXA2 ratio is attributed to pathogenesis in PIH.3 Abnormal lipid metabolism is associated to preeclampsia.4 This study was aimed to investigate the relationship between serum lipid and risk of PIH.
MATERIALS AND METHODS
This is a prospective study which was conducted in the Department of Obstetrics and Gynecology, KS Hegde Medical Academy, Deralakatte, a tertiary care center in the state of Karnataka, India. This study was conducted between November 2015 and January 2017. Approval from Ethics Committee was taken.
Inclusion Criteria
Primigravida and multigravida with singleton pregnancy with 14–20 weeks as determined by LMP or scan.
Exclusion Criteria
Patients having multiple pregnancy, chronic hypertension, diabetes, congenital anomalies known renal disease, hepatic dysfunction, dyslipidemia, and preexisting hypertension before pregnancy were excluded from the study.
In a prospective study, 90 antenatal women between 14 and 20 weeks of singleton pregnancy were evaluated. All the women were informed and consent taken before they were enrolled in the study. Detailed history including—age, parity index, height, prepregnancy weight, and weight at the time of blood collection was taken. Family history, past obstetric history, medical history, smoking, histories of first degree family were taken. Systemic examination like pedal edema, BP, and gestational age was carried out and ANC investigations were done. Gestational age was calculated from “reliable last menstrual history and early ultrasonography measurement of fetal crown rump length” and 3 mL venous blood was taken. Lipid profile estimation is done by enzymatic spectrophotometry. Patients were followed up 4 weekly till 28 weeks and every 15 days up to 34 weeks and every week till delivery. At each visit, blood pressure was recorded.
RESULTS
Ninety women were available for this study, but only 81 (90%) women were followed completely till term. Nine women never came for follow-up. Out of the 81 women who completed the study, 12 (14.8%) cases developed hypertension and 69 women remained normotensive (Tables 1 to 5).
| PIH (12) | Normal (69) | p value | ||
|---|---|---|---|---|
| Age (years) | Mean ± SD | 27.08 ± 4.5 | 26.8 ± 3.9 | 0.87 |
| BMI (kg/m2) | Mean ± SD | 24.5 ± 2.08 | 23.9 ± 2.6 | 0.42 |
Mean age among PIH group is 27.08 years, and BMI is 24.5 kg m2
Normotensive group has a mean age of 26.8 years and a mean BMI of 23.9 kg/m2. Both the group are almost similar
| BP | PIH (n = 22) | Normotensive (n = 69) | p value |
|---|---|---|---|
| At 1st visit | |||
| Systolic (mm Hg) | 118.1 ± 8.1 | 114.80 ± 7.3 | 0.15 |
| Diastolic (mm Hg) | 78.3 ± 3.8 | 75.9 ± 6.7 | 0.19 |
| At delivery | |||
| Systolic (mm Hg) | 139.1 ± 20.6 | 118.4 ± 8.3 | <0.001 |
| Diastolic (mm Hg) | 90 ± 7.3 | 77.8 ± 4.8 | <0.001 |
Blood pressure at the time of first visit was not significant, but at the time of delivery for PIH patient was significantly high in comparison with normotensive women. (p value < 0.001)
| Variable | PIH (n = 12) | Normotensive (n = 69) | p value |
|---|---|---|---|
| Total cholesterol (mg/mL) | 233.25 ± 47.1 | 189 ± 32.9 | <0.001 |
| Triglycerides (mg/mL) | 146 ± 27.5 | 139.1 ± 46.5 | 0.621 |
| HDL (mg/dL) | 61.5 ± 10.4 | 59.25 ± 12.7 | 0.551 |
| LDL (mg/dL) | 127 ± 30.7 | 103.7 ± 29.8 | 0.012 |
| VLDL (mg/dL) | 32.63 ± 12.1 | 32.3 ± 11.25 | 0.933 |
Comparison of two groups of cholesterol shows that cholesterol is higher in PIH group with t value −03.95 and is statistically significant.
Comparison of TG and HDL of the two groups is statistically not significant as p values are 0.621 and 0.551, respectively, though their values are higher in PIH group.
Comparison of LDL between the two group shows that LDL is higher in PIH group with t value of −02.586 and is significant statistically.
Comparison of VLDL shows it is higher in normotensive group with p value 0.933
| Variable (mg/dL) | PIH (n = 12) | Normal (n = 69) | Total |
|---|---|---|---|
| Total cholesterol | |||
| %3E;200 | 8(66.7%) | 22(31.9%) | 30 |
| <200 | 4(33.33%) | 47 (68.1%) | 51 |
| Triglycerides | |||
| ≥156 | 4 (33.33%) | 23 (33.33) | 27 |
| <156 | 8 (66.6%) | 46 (66.6%) | 54 |
| LDL-cholesterol | |||
| ≥117 | 7 (58.3%) | 20 (28.9%) | 27 |
| <117 | 5 (41.6%) | 49 (71.01%) | 54 |
DISCUSSION
Among the 81 women who completed the study, 12 (14.8%) women subsequently developed PIH and 69 women remained normotensive. In the study done by Vidyabharati et al.,5 164 women at 14–20 weeks of gestation completed the study, 29 (17.7%) developed GH. In the study done by Kaur et al.,6 178 women out of the 200 women enrolled completed the study. Out of which 22 (12.35%) developed GH and 156 remained normotensive.
Age
In our study, mean age among the GH group was 27.08 years, and among the normotensive group, it was 26.8 years. In the study by Vidyabharathi et al.,5 mean age was 27.17 years.
In present study, there is relation between dyslipidemia and preeclampsia risk. On evaluation, mean TC was 238.25 mg/dL, mean HDL was 61.5 mg/dL, and mean LDL was 127 mg/dL, which is significant in the development of PIH. Similarly Anuradha et al.7 in her study got TC of 160.9 mg/dL and HDL of 66.38 mg/dL, which is slightly more than ours. Deshpande et al.8 reported high lipid profiles with TC of 208 mg/dL and HDL was 38.06 mg/dL. Similarly, Enquobahrie et al.9 observed “an association between early pregnancy dyslipidemia and PIH”. Some more studies showed association between hyperlipidemia and pregnancy-induced hypertension and that of many other studies (Figs 1 to 4).4,8,10
We observed that the high cholesterol level increases the incidence of PIH, whereas if the cholesterol is at the normal range, the incidence of PIH is less.3 There is no much influence of triglycerides level in blood and PIH. LDL definitely has a role. If LDL level is >117 mg/dL, there is an increased risk of developing PIH.
Singh et al.4 in his study “observed that if TC, TG, VLDL-C, and LDL-C levels were higher in early second trimester, there was increased risk of developing preeclampsia and severity of preeclampsia was directly related to levels of total cholesterol, triglycerides, and VLDL-C, which were statistically significant”. They also observed that “dyslipidemia, particularly hypertriglyceridemia and elevated lipoprotein, precede the clinical manifestation of preeclampsia and thus may be of etiologic and pathophysiologic importance in this relatively common complication of pregnancy”.
In Padama Leela et al.11 observed that “total cholesterol (TC), triglycerides, and very low-density lipoprotein (VLDL) values in pregnant women were higher than the corresponding TC, triglycerides, and VLDL in nonpregnant women”. HDL mean value was found less in hypertensive group. In the present study, we observed “an association between abnormal lipid profile in early pregnancy and subsequent risk of gestational hypertension or preeclampsia”.
CONCLUSION
Elevated levels of serum lipid profiles in the first trimester are associated with pregnancy-induced hypertension. These patients with elevated lipid profile should be observed carefully. They should modify their lifestyle with low lipid diet and regular exercise, which will help them to control the lipid.
STATISTICAL ANALYSIS
The collected information was summarized using frequency, percentage, mean, and standard deviation. To compare the lipid profile between the subjects who develop PIH with that of normotensive, independent sample ‘t’ test was used. If the data were not following normal distribution, “Mann Whitney U test is used, and the p %3C; 0.05 was considered statistically significant”.
| Parameter | Sensitivity (%) | Specificity (%) | Positive predictive value (%) | Negative predictive value (%) | Diagnosic accuracy (%) | p value |
|---|---|---|---|---|---|---|
| Total cholesterol | 66.7 | 68.10 | 26.70 | 92.20 | 67.90 | 0.0280 |
| Triglycerides | 33.30 | 66.70 | 14.80 | 85.20 | 61.73 | 1.0000 |
| LDL | 58.30 | 71.00 | 25.90 | 90.70 | 69.14 | 0.0930 |
Total cholesterol (%3E;200 mg/dL) has a sensitivity of 66.7% and a specificity of 68.10% and has an overall accuracy of 67.9%. The test and the gold standard agree on 55 out of 81 having a diagnostic accuracy of 67.9%.
Triglycerides has a sensitivity of 33.3% and a specificity of 66.7%. The test has a positive value of 14.8% and a negative predictive value of 85.2%. The test and the gold standard agree on 50 out of 81 having a diagnostic accuracy of 61.72%. The kappa value of 0 indicates poor agreement with a p value of 1

Fig. 1: Comparison of mean ± SD of the serum lipid profile between PIH and normotensive group

Fig. 2: Out of 30 patients who had cholesterol >200 mg/dL, 8 had PIH and 22 remained normotensive. Out of 51 patients who had cholesterol <200 mg/dL, only 3 developed PIH

Fig. 3: LDL cutoff 117 out of 27 patients who had LDL >117, 7 women developed PIH, and 20 remained normotensive. Out of 54 women who had LDL <117, 5 developed PIH and 49 remained normotensive
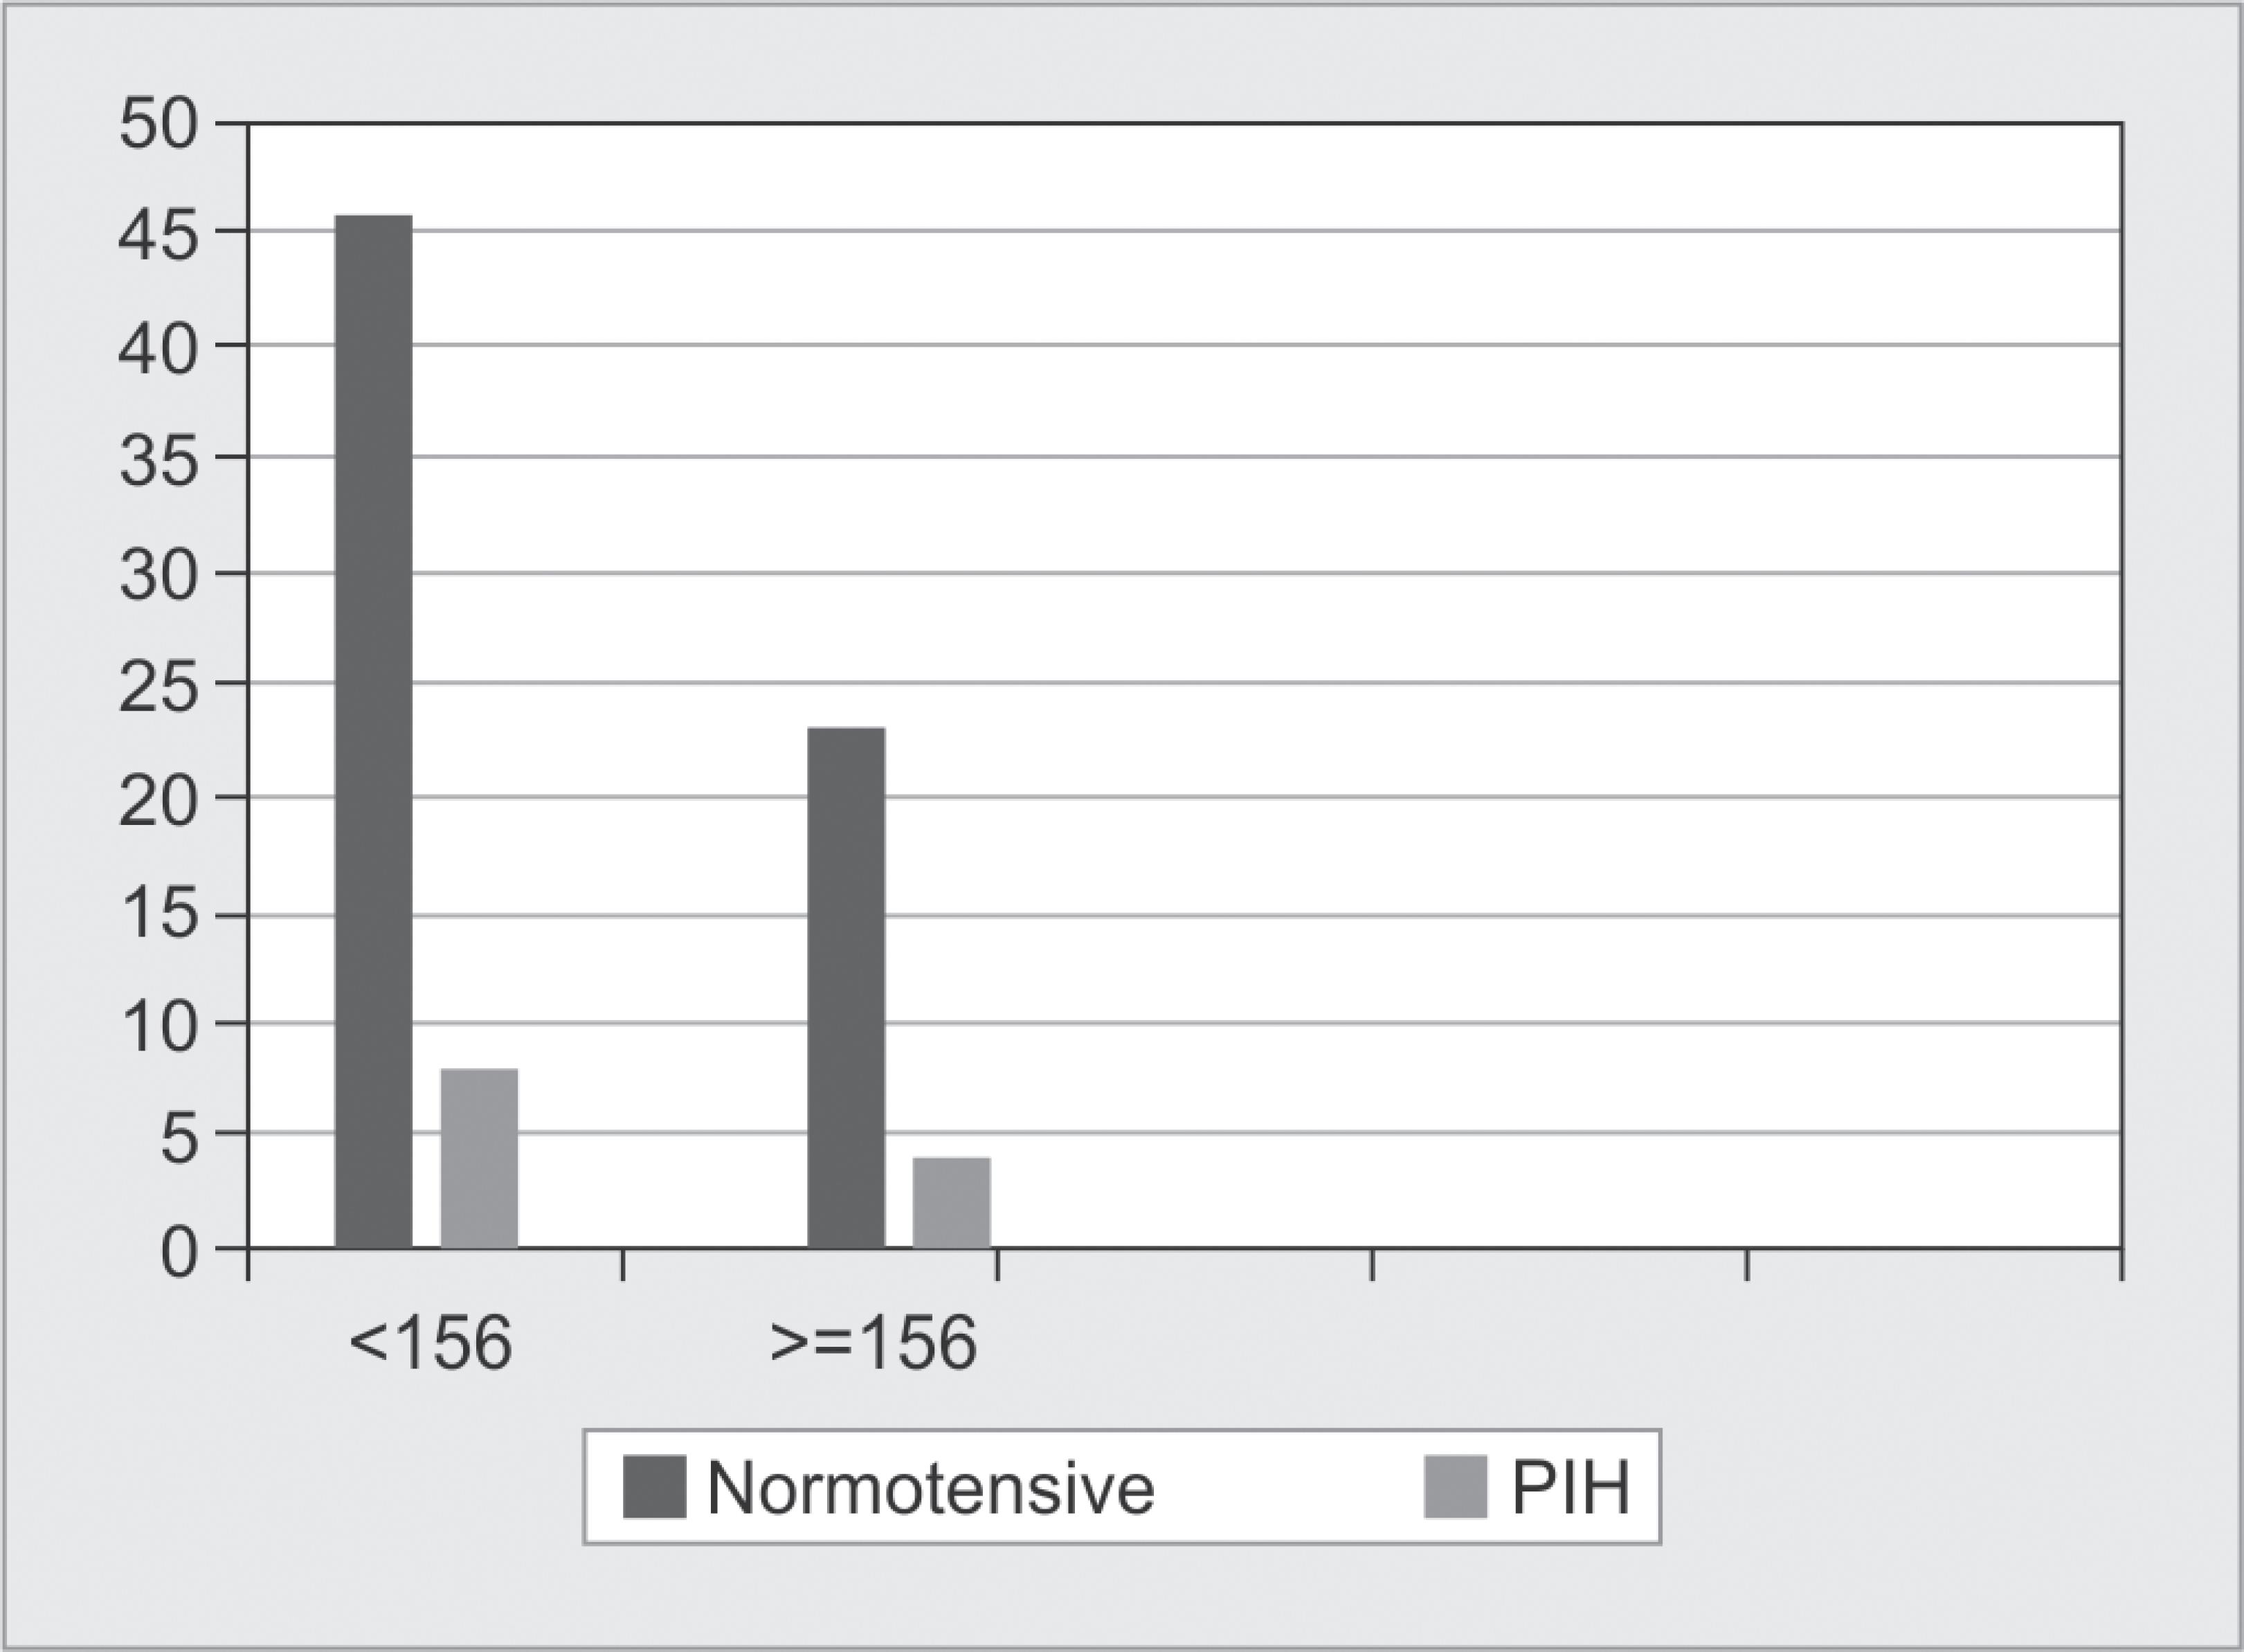
Fig. 4: Four women turned to be hypertensive who showed TG >156 mg/dL of total 27 women and rest 23 remained normotensive. Out of 54 who had TG <156 mg/dL, 8 developed PIH and rest 46 maintained normotensive
KNOWLEDGE GAP
Patients with PIH risk can be identified earlier using serum lipid levels and early interventions can be sought to prevent complications.
REFERENCES
1. Cunningham FG, Leveno KJ, Bloom SL, et al. Pregnancy hypertension. In: ed. J, Kenneth et al. Williams obsterics. 23. New York: McGraw-Hill; 2010. p. 706.
2. Powers RW, Bodnar LM, Ness RB, et al. Uric acid concentrations in early pregnancy among preeclamptic women with gestational hyperuricemia at delivery. Am J Obstet Gynecol 2006;194(1):160. DOI: 10.1016/j.ajog.2005.06.066.
3. Robson SC. Hypertension and renal disease in pregnancy. In: Edmonds DK. Dewhurst’s Textbook of Obstetrics and Gynaecology for postgraduates.New York: Blackwell Science; 1999. pp. 167–169.
4. Singh U, Yadav S, Mehrotra S, et al. Serum lipid profile in early pregnancy as a predictor of preeclampsia. Int J Med Res Rev 2013;1(2):56–62. DOI: 10.17511/ijmrr.2013.i02.03.
5. Vidyabharathi RK, Davina H, Singh NK, et al. Serum beta hCG and lipid profile in second trimester as predictors of pregnancy induced hypertension. J Obstet Gynecol India 2010;60:44–50.
6. Kaur G, Jain V, Mehta S, et al. Prediction of PIH by maternal serum beta hCG levels in the second trimester of pregnancy. J Obstet Gynaecol India 2012;62(1):52–54. DOI: 10.1007/s13224-012-0151-y.
7. Anuradha R, Durga T. Estimation of lipid profile among preeclamsia women by comparing with pregnancy. Int J Med Res Rev 2016;3(7):2454–7379.
8. Deshpande H, Chandrakanth M, Poona MV, et al. Study of serum lipid profile pregnancy induced hypertension. Indian J Appl Res 2016;6:546–548.
9. Enquobahrie DA, Williams MA, Butler CL, et al. Maternal plasma lipid concentrations in early pregnancy and risk of preeclampsia. Am J Hypertens 2004;17(7):574–581. DOI: 10.1016/j.amjhyper.2004.03.666.
10. Jameela Poonmalar Ar, Jesuthangam M, Vishnupriya S. Materanal lipid during early pregnancy as predictor of pregnancy induced hypertension. Int J Gynecology 2019;9(3).
11. Padma Leela K, Rama Devi G, Neeraja M. Study of serum lipid profile in second trimester as predictor of hypertensive disorder complicating pregnancy. Int J Preclinical Pharmac Res 2012;3(2):114–117.
________________________
© The Author(s). 2020 Open Access This article is distributed under the terms of the Creative Commons Attribution 4.0 International License (https://creativecommons.org/licenses/by-nc/4.0/), which permits unrestricted use, distribution, and non-commercial reproduction in any medium, provided you give appropriate credit to the original author(s) and the source, provide a link to the Creative Commons license, and indicate if changes were made. The Creative Commons Public Domain Dedication waiver (http://creativecommons.org/publicdomain/zero/1.0/) applies to the data made available in this article, unless otherwise stated.